The "Layoffs Data" in MySQL refers to a dataset tracking company layoffs, including details like company name, industry, date of layoff, number of employees affected, and location. This dataset is useful for analyzing trends in workforce reductions across industries and regions.

Explored Layoffs Data Using Sql,Delving Into Trends And Insights To Understand Layoffs In The Companies.
utilized Tableau's powerful features to create dynamic and interactive dashboards


Analyzed Pizza Sales Data Creating Compelling Visualizations That Provided Actionable Insights And Facilitated Data-Driven Decision-Making For businesses and Their Store Sales.

Sales Analysis using Python involves analyzing sales data to identify trends, patterns, and performance metrics. By leveraging libraries like Pandas, Matplotlib, and Seaborn, insights are derived to drive business decisions and optimize sales strategies.

This Project Help Me to Master BeautifulSoup And Requests In Python And Help Me To Understand How To Get Data From Different Websites.
Project On Excel I Have build A Dashboard On Bike Sales Data.

Developed and implemented a data classification model for Anoma data, enhancing data categorization accuracy and improving overall processing efficiency.

Analyzed and visualized COVID-19 data using SQL to extract insights on infection trends, recovery rates, and mortality. Utilized complex queries to aggregate data, perform joins, and generate reports for decision-making.
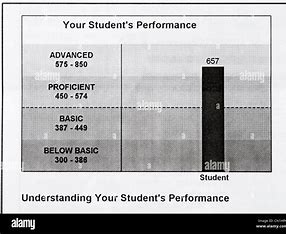
Developed a comprehensive student score analysis tool that visualizes performance trends across subjects, identifying key areas for improvement. Implemented statistical techniques to provide actionable insights for educators.
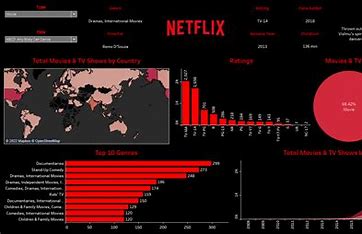 Analyzed Netflix user data to uncover viewing patterns, genre preferences, and engagement trends, leveraging Python to generate actionable insights that drove content recommendations.

Predict the Loan Status based on various features. Models used- Logistic Regression, KNN, Xgboost.

Developed a comprehensive movie data analysis project, leveraging Python and Pandas to explore trends in genres, box office performance, and ratings. Visualized insights using Matplotlib and Seaborn to drive data-driven storytelling.

Conducted comprehensive health monitoring analysis on portfolio performance, identifying key trends, risk factors, and growth opportunities to optimize investment strategies.
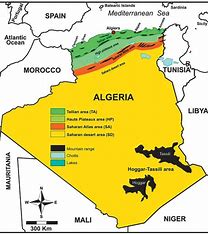
Developed a Machine Learning model to predict Algerian forest fires using historical weather data, optimizing for early detection and prevention strategies.Applied data preprocessing, feature engineering, and model tuning to enhance prediction accuracy.
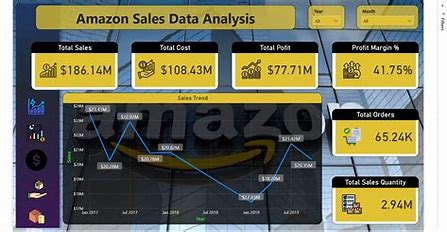
The Amazon Sales Analysis in Tableau project involves visualizing and analyzing sales data to gain insights into the performance of products, sales trends, customer behavior, and profitability. It allows businesses to make informed decisions based on historical data, predict future trends, and optimize strategies.

Developed a Bank Loan Analysis project using Python, performing data cleaning, exploratory data analysis (EDA), and visualization to identify key factors influencing loan approval. Utilized Pandas, NumPy, Matplotlib, and Seaborn for analysis and insights.